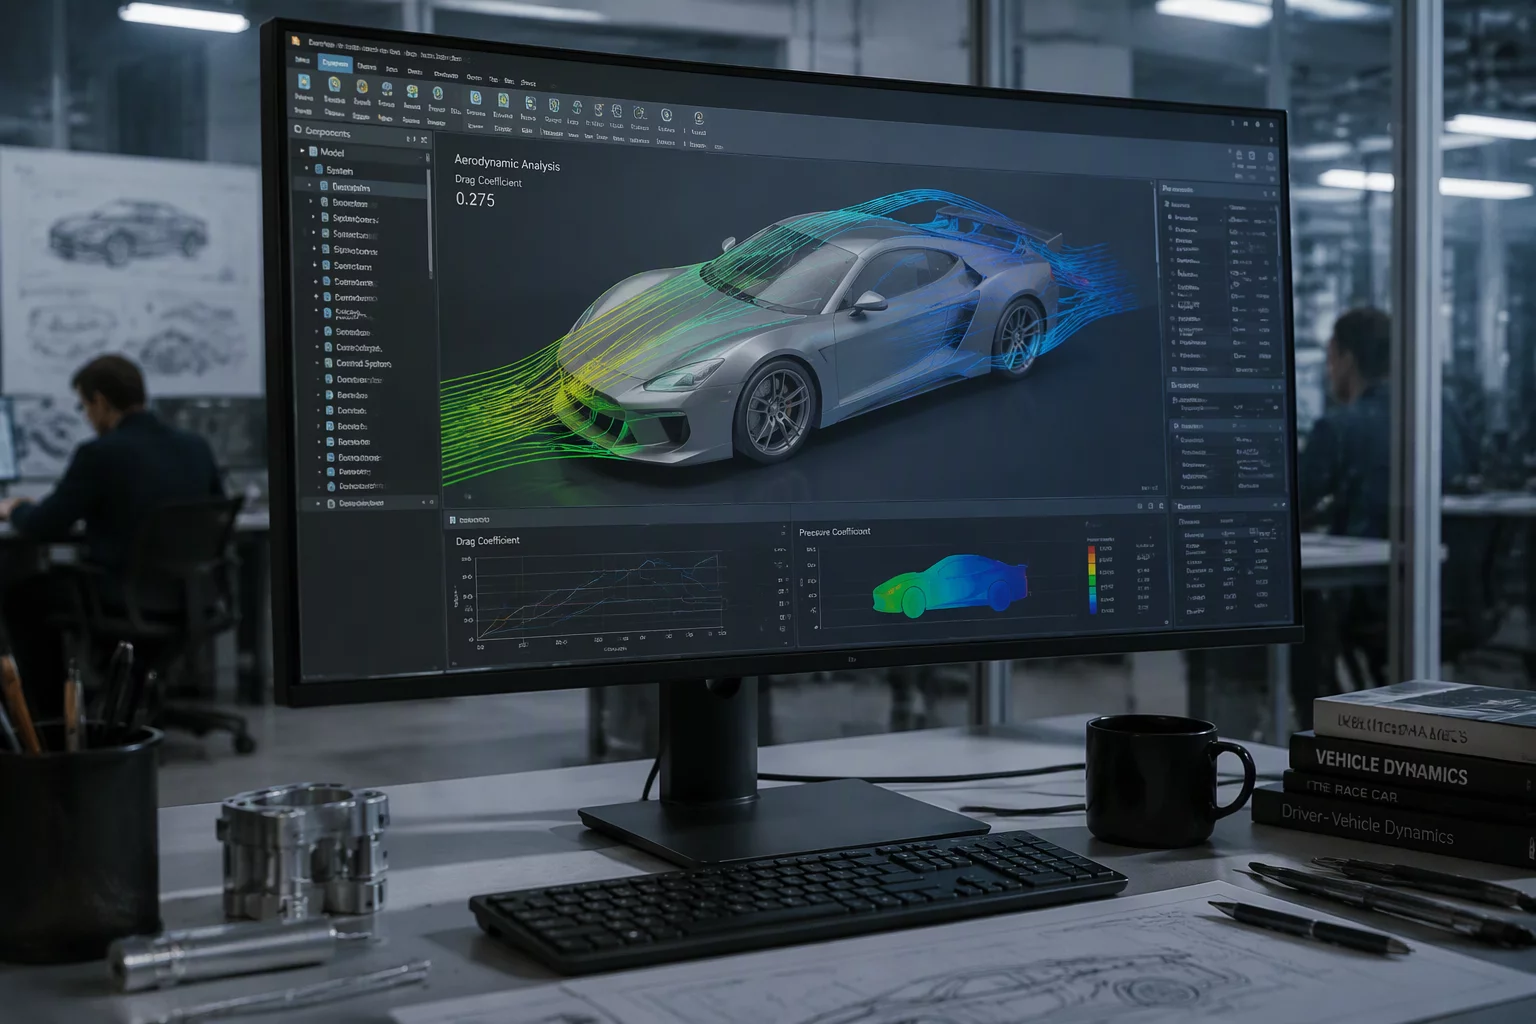
ASM Sports Tech Automotive Trends Guide
Comprehensive review of digital modeling and systems engineering telemetry under high-stress powertrain simulations.
Explore cases about baseline data, recording conditions, events, notes, repeat observations, and comparison.
Every case in this journal is reviewed against one central question:
“What was happening when this data was recorded?”
Written for automotive diagnostics learners, enthusiasts, calibration professionals documenting test sessions, and workshop teams.
Core telemetry concepts distilled into one-line definitions so technical logs make immediate sense to everyone.
A reference recording captured during nominal operating conditions to establish normal sensor ranges before diagnosing anomalies.
A specific time slice capturing milliseconds before and after a triggered deviation for frame-by-frame data inspection.
The environmental snapshot of load, voltage, and temperatures recorded at the precise instant a diagnostic fault code registers.
A concise technical log detailing observed deviations, channel configs, and test conditions passed between analyzing technicians.
Understanding the investment, time commitment, and analytical rigor required for precise data logging and methodology.
Capturing structured time-series data during test runs prevents trial-and-error parts replacement. A standardized baseline log reduces intermittent fault isolation time from several days to under 45 minutes.
Most contemporary analysis platforms support modular ISO 13400 (DoIP) and ISO 11898-1 standards via existing Ethernet adapters and compliant interface hardware, avoiding complete lab redesigns.
Technicians do not need to memorize raw hex bytes. By utilizing graphical overlay analysis and baseline delta overlays, abnormal sensor deviations become immediately visible on standard curves.
Every modification, verification step, and signal trace is logged with immutable timestamps. This provides complete audit trails that prove root causes and validate repair efficacy to vehicle owners.
Field metrics demonstrate the measurable reduction in shop diagnostic hours when transitioning from unsystematic testing to structured log documentation.
Our independent laboratory analysts and technical editors bring decades of rigorous experience in vehicle network diagnostics, high-frequency bus logging, and data verification standards.

Over 14 years documenting CAN FD and DoIP protocol stacks, validating multi-channel engine log synchronized time-series data.

Former OEM systems researcher specializing in high-frequency sensor telemetry baseline comparisons and flight-recorder error modeling.

Specializes in diagnostic software review, structured oscilloscope artifact isolation, and systematic fault reproduction guides.
LogContext Journal aligns its comparative verification methodologies with global diagnostic and communication protocols.
Without structured log archiving, standardized cross-referencing, and methodical parameter mapping, diagnostic workflows accumulate silent friction. Calculate the measurable hours and verification loops lost to unindexed telemetry.
Adjust the sliders to reflect your weekly diagnostic volume and manual review overhead.
Time spent hunting missing PID references and unindexed frame drops across raw CSV files.
Repeated test drives triggered strictly by unverified sampling rates or missing trigger baselines.
Transient sensor glitches that disappear from diagnostic memory without standardized recording.
Operational capacity drained by uncoordinated diagnostic notes and unstructured file structures.
Diagnostic ambiguity does not resolve on its own. Continuing without documented logging protocols multiplies verification cycles with every newly introduced firmware protocol or multichannel telemetry interface.
Peer-reviewed data evaluations, protocol compliance assessments, and systematic signal captures from current vehicular diagnostic studies.
Comprehensive review of digital modeling and systems engineering telemetry under high-stress powertrain simulations.
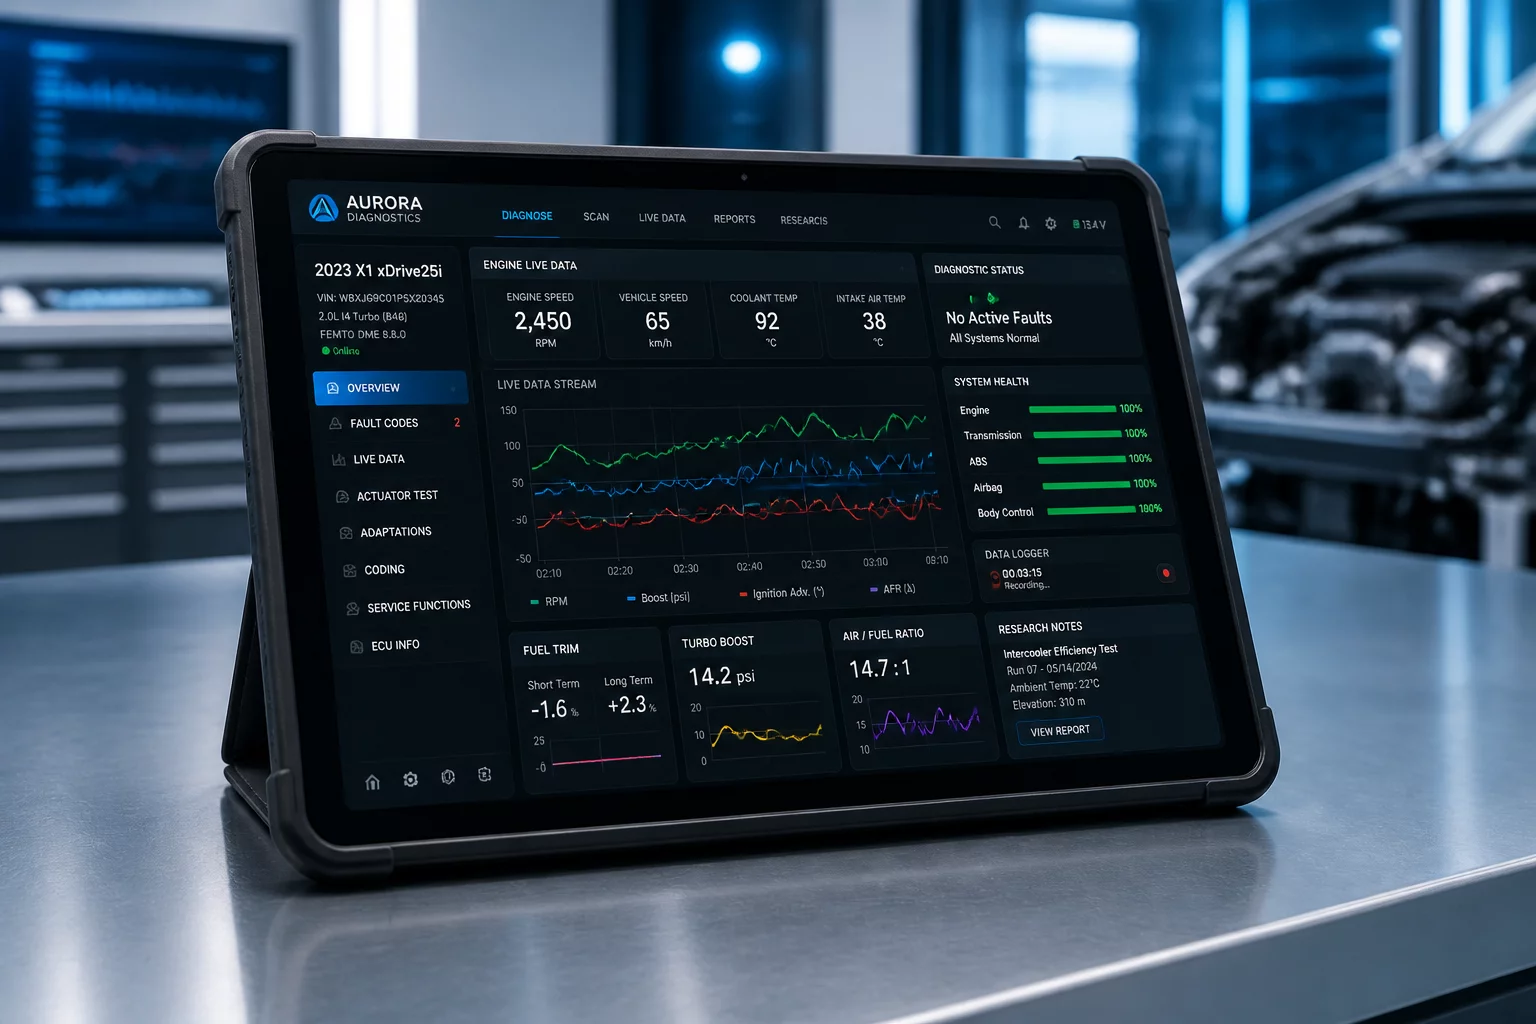
Analysis of rising electrical complexity, scan tool protocol fragmentation, and high-bandwidth datalogging requirements.
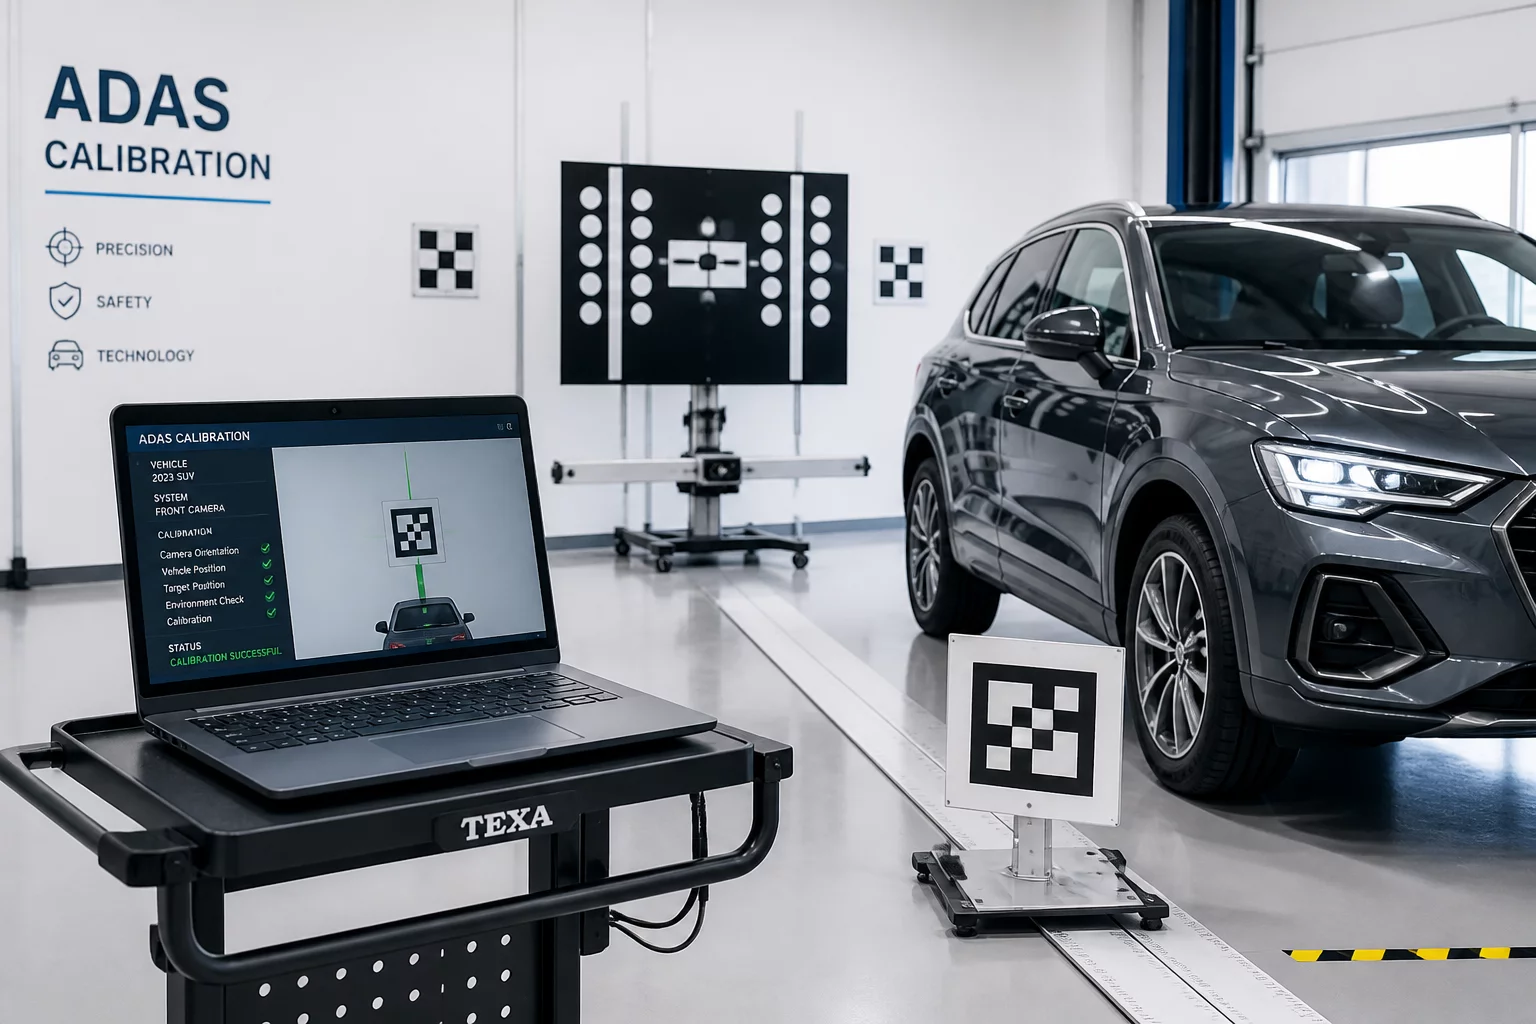
Detailed case study tracking multi-sensor ADAS calibration errors, live radar data frames, and dynamic alignment verification.
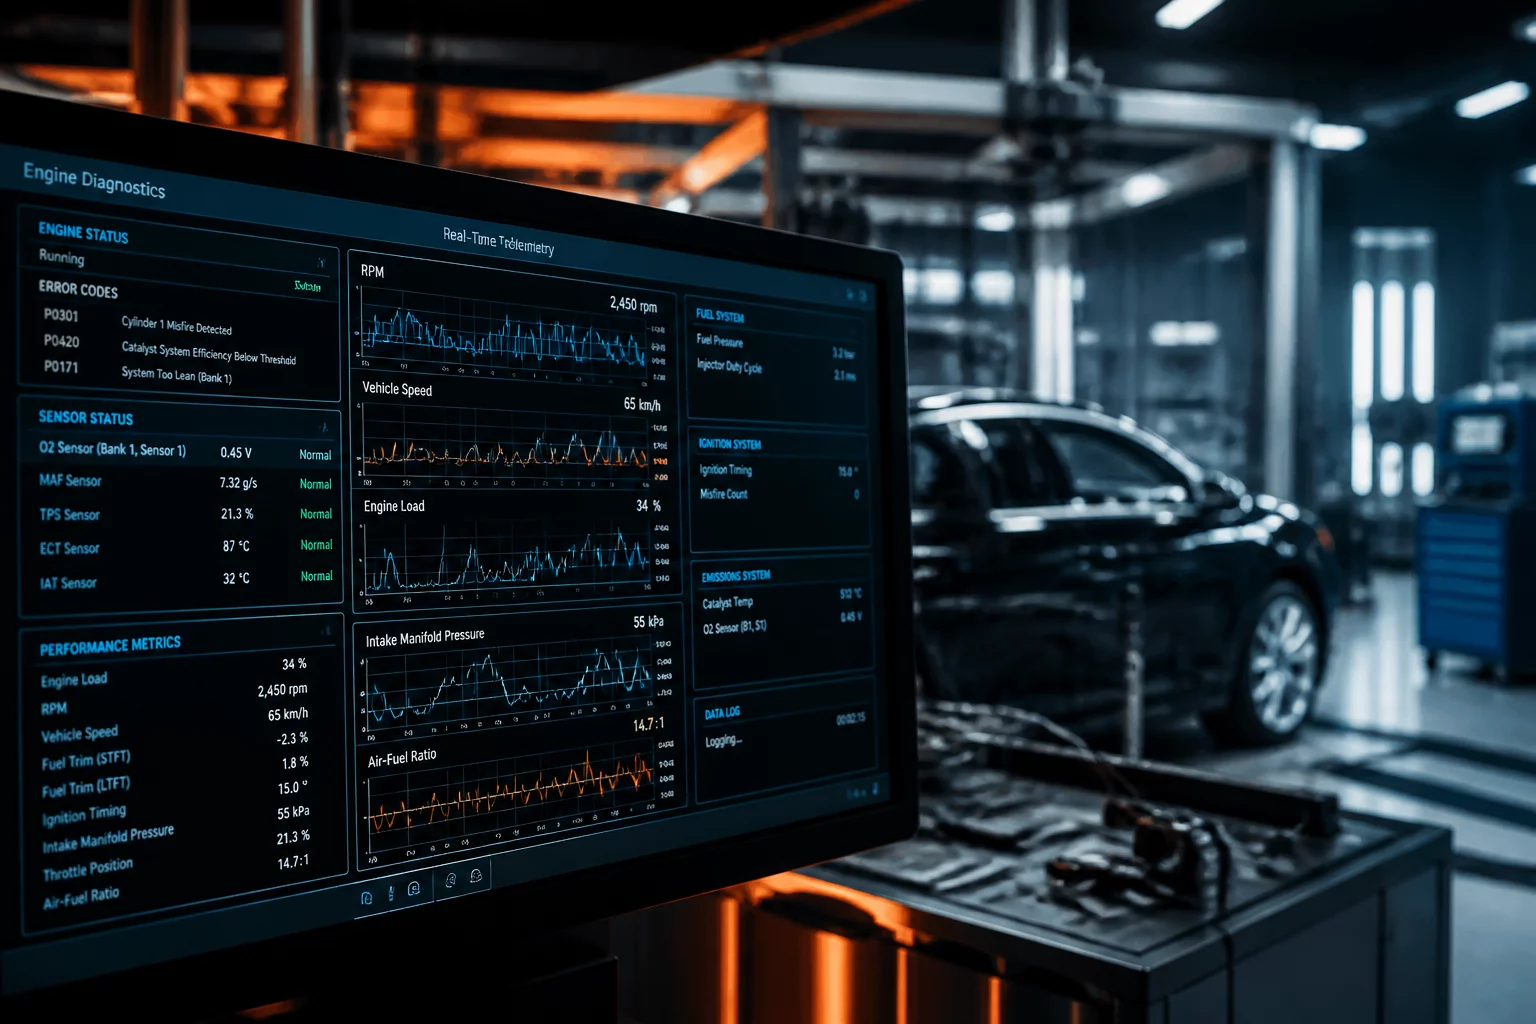
Two recording sessions compared as a before/after pair — where the operating context moved alongside the signal.
Two recording sessions compared as a before/after pair — where the operating context moved alongside the signal.
Marked three-minute segment over a fixed route section. Ambient 11°C, documented warmup, matched fuel level and tyre pressures.
Same marked segment on the same route. Ambient 26°C — the intake component changed, and so did the operating context.
Ambient / operating context differed
Observed signal differed
Conclusion remains limited
Next comparable test defined
Structured case reviews written around recording context — question, vehicle state, conditions, window, observation, follow-up.
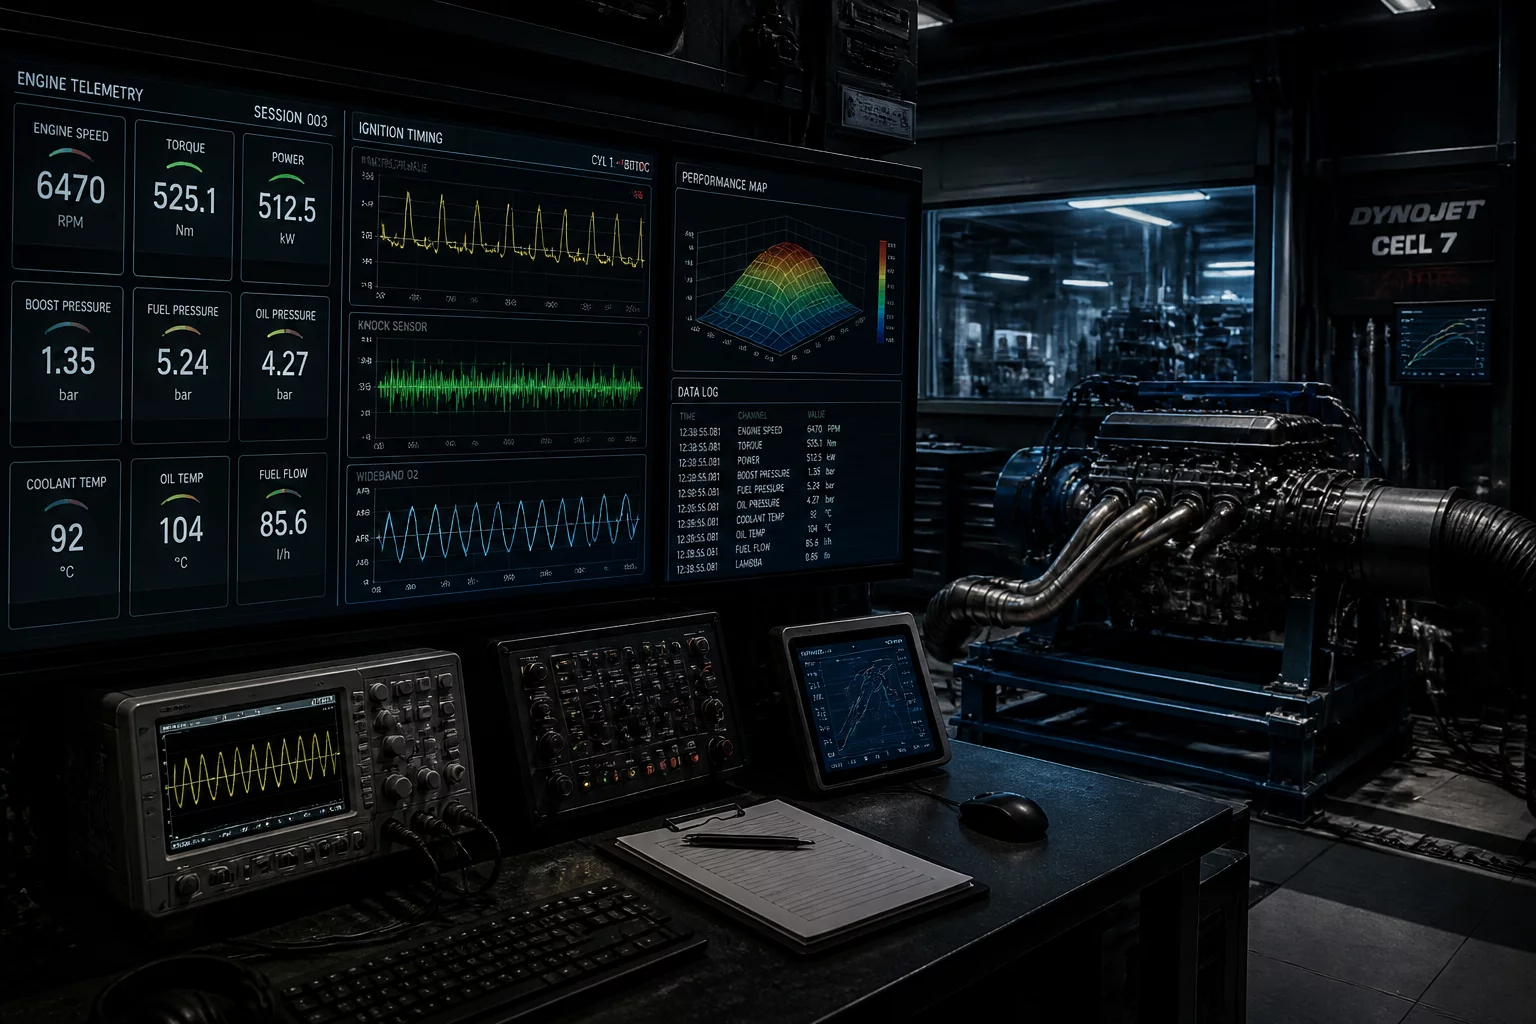
Why every useful recording session starts with a written diagnostic question.
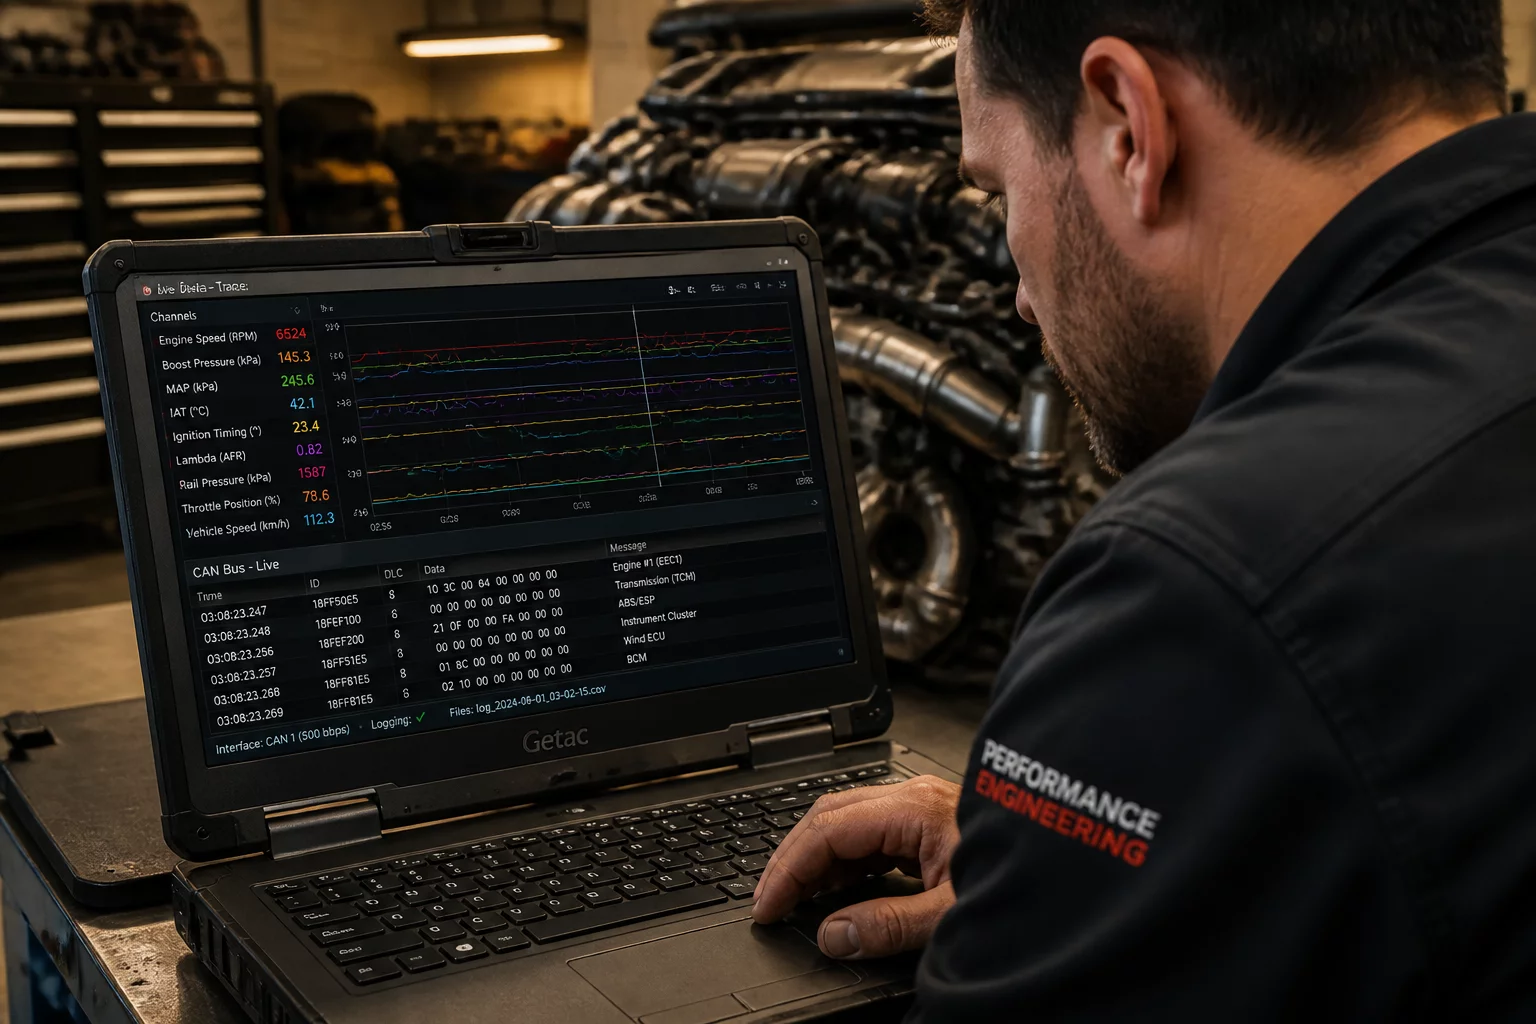
A follow-up log is only comparable when a documented baseline exists.
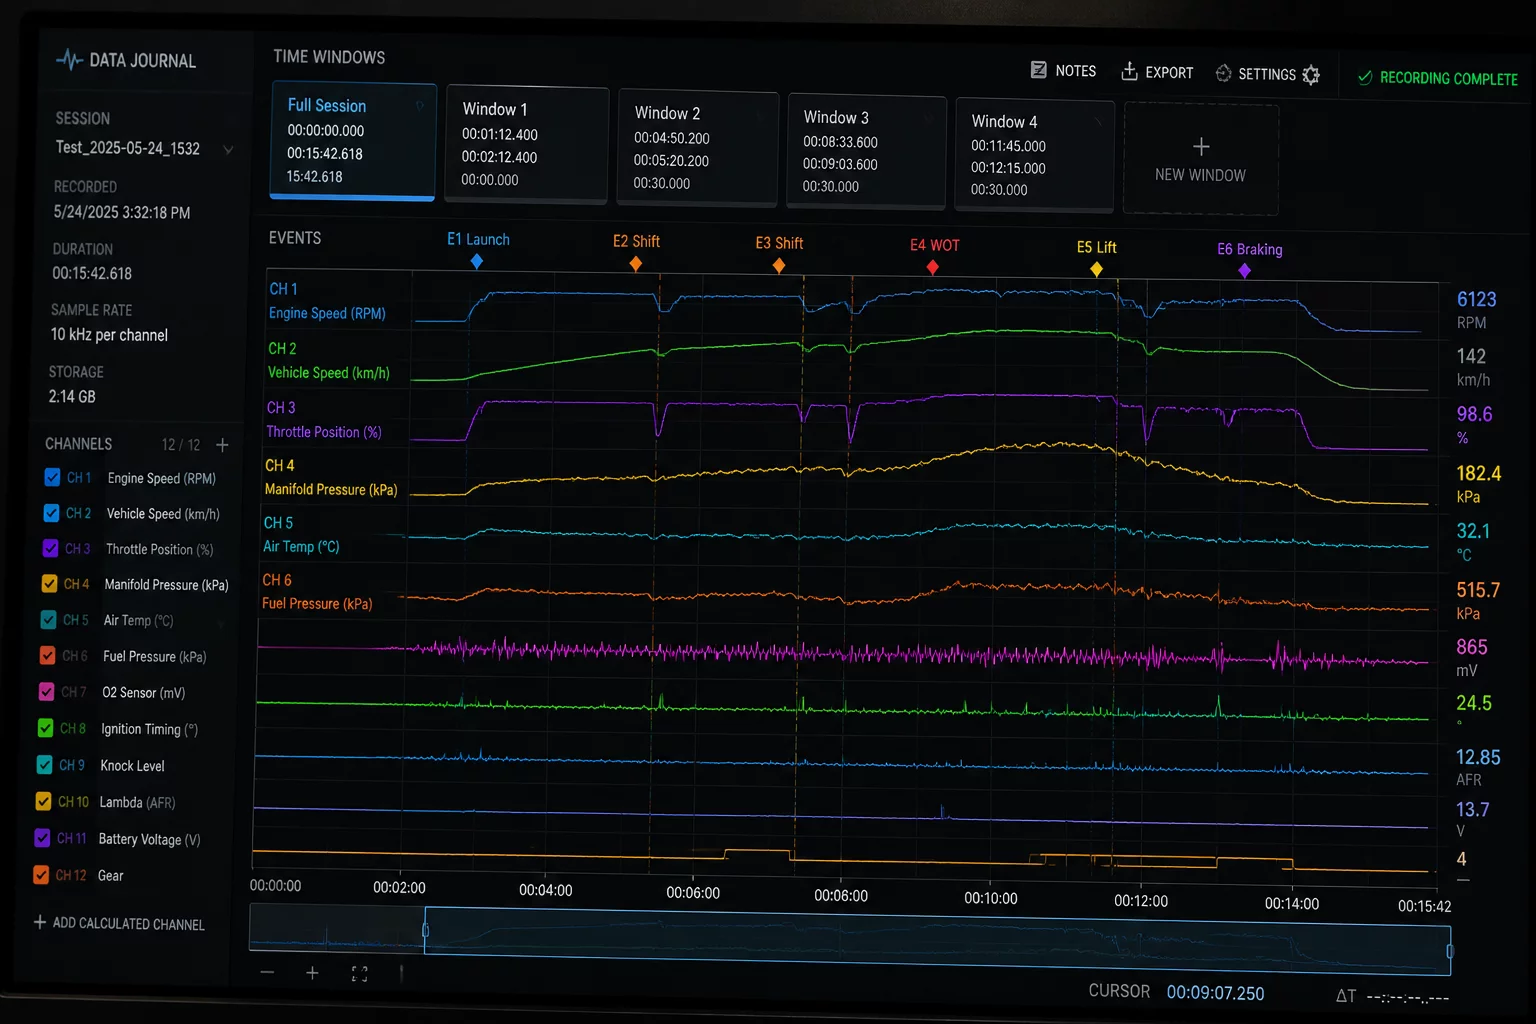
The data was perfect — for the wrong three minutes.
Two logs of the same car told different stories — because the conditions were never matched.
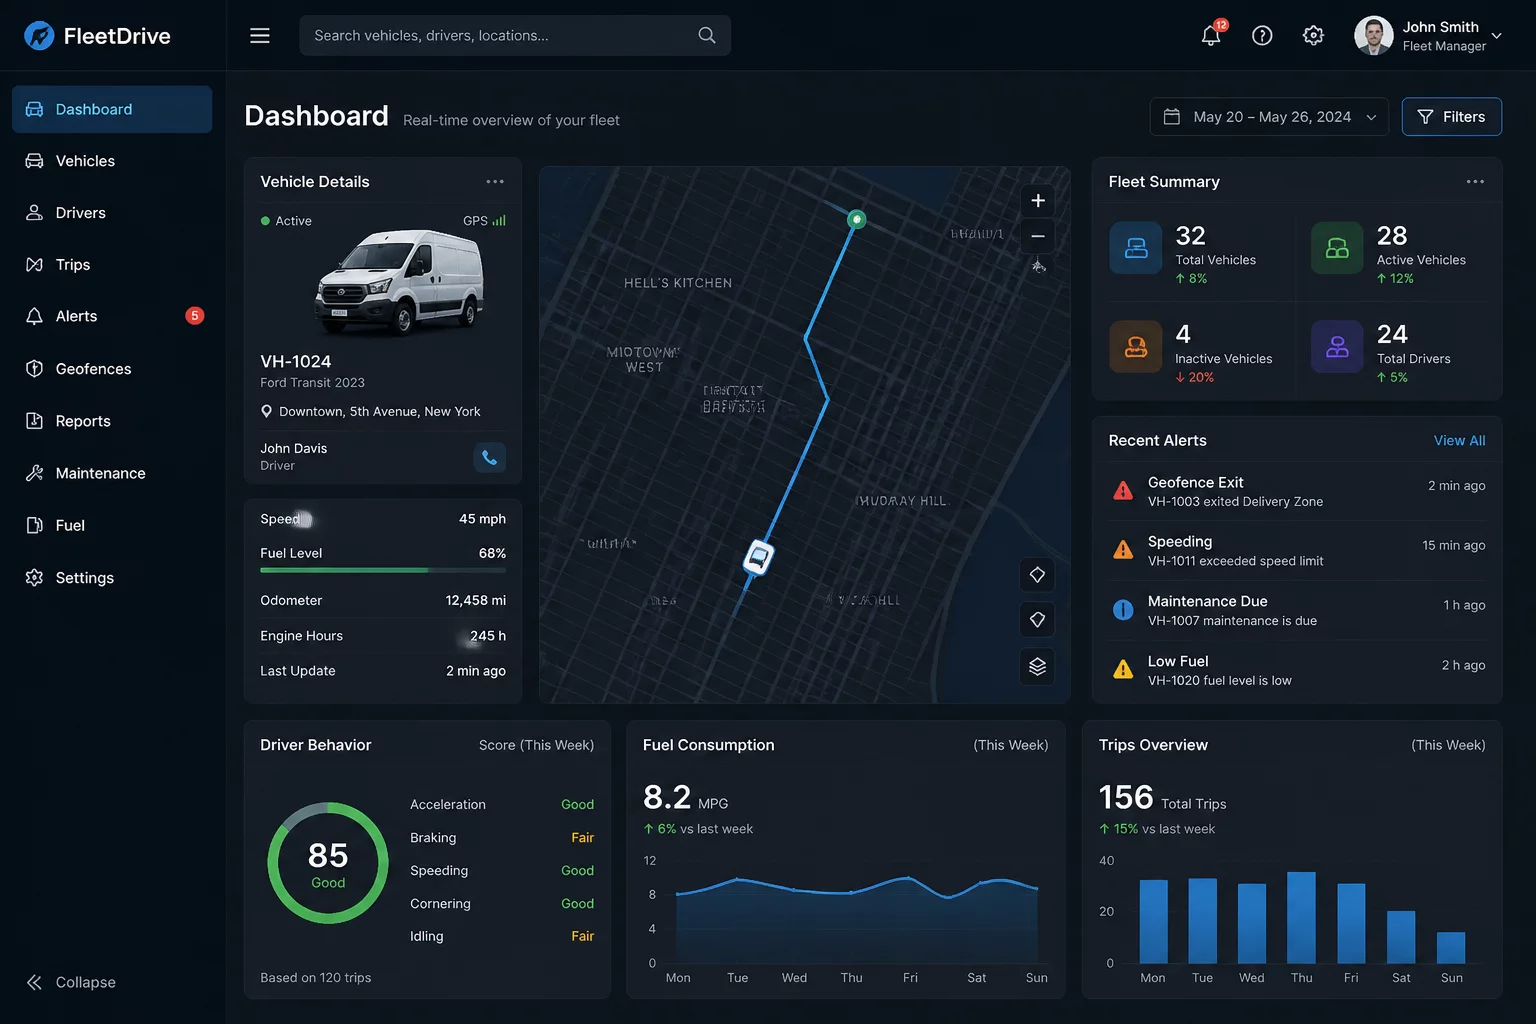
A single logged pull looked alarming — until the repeats showed noise.
A code found after the session is not automatically caused by the session.
Matching two sessions closely enough that the remaining delta means something.
Handoff notes are the difference between re-analysis and re-watching.
Rigorous engineering frameworks, communication protocols, and standardized diagnostic data logging workflows.
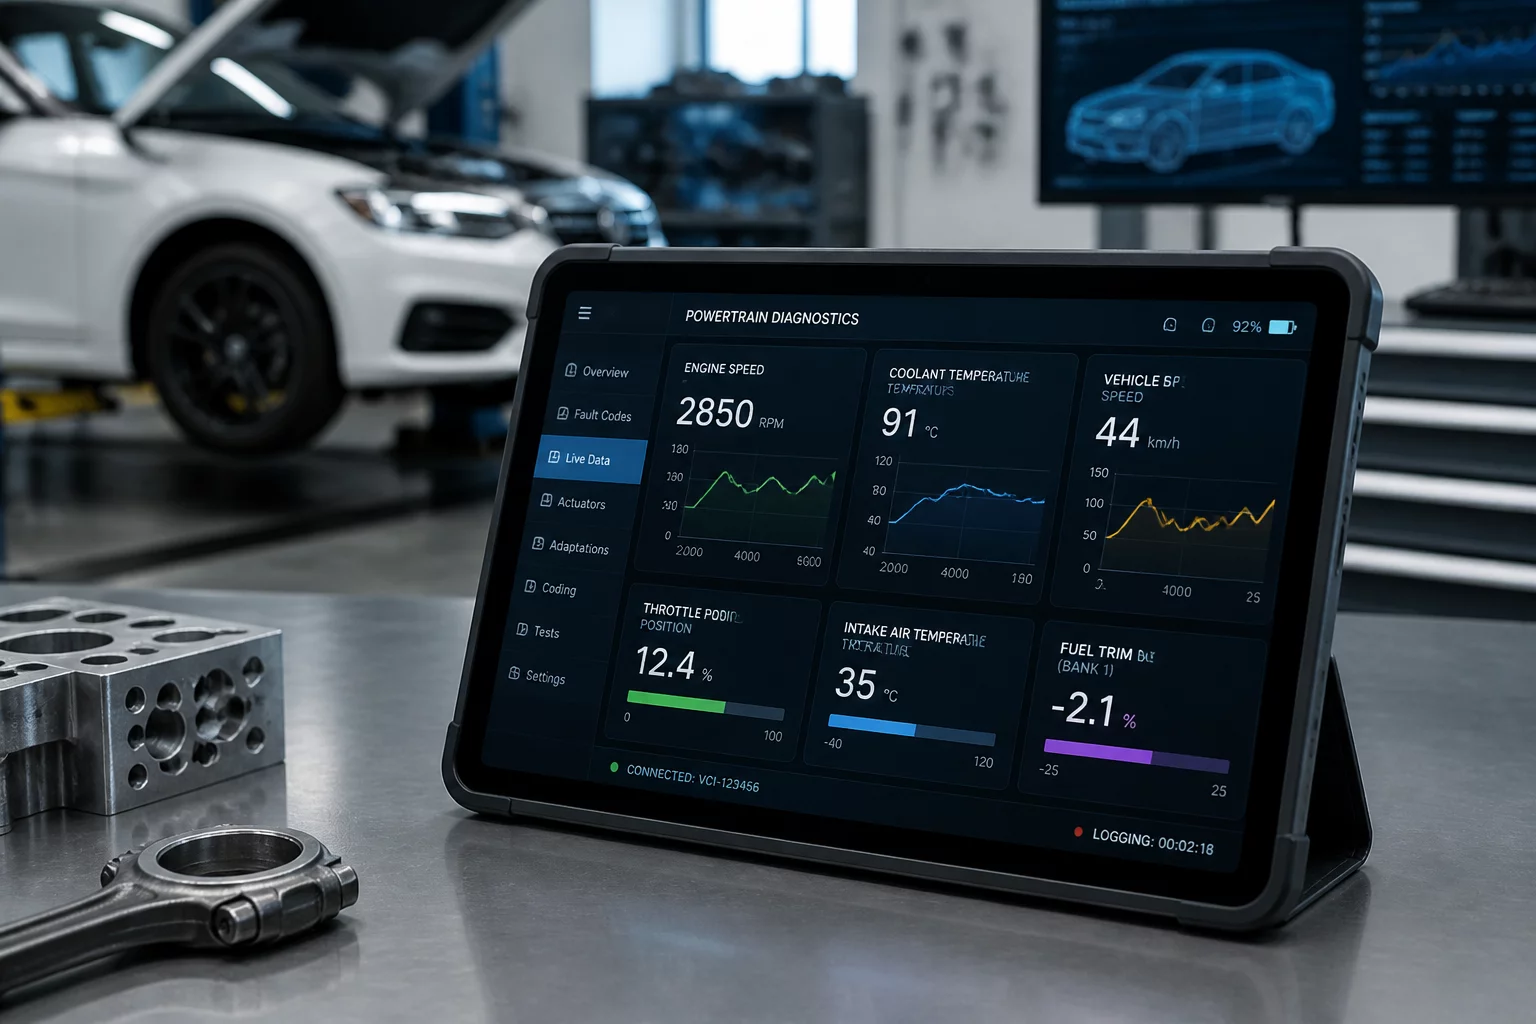
Comprehensive evaluation of next-generation diagnostic protocol integration, focusing on real-time data frame synchronization and compliance testing.
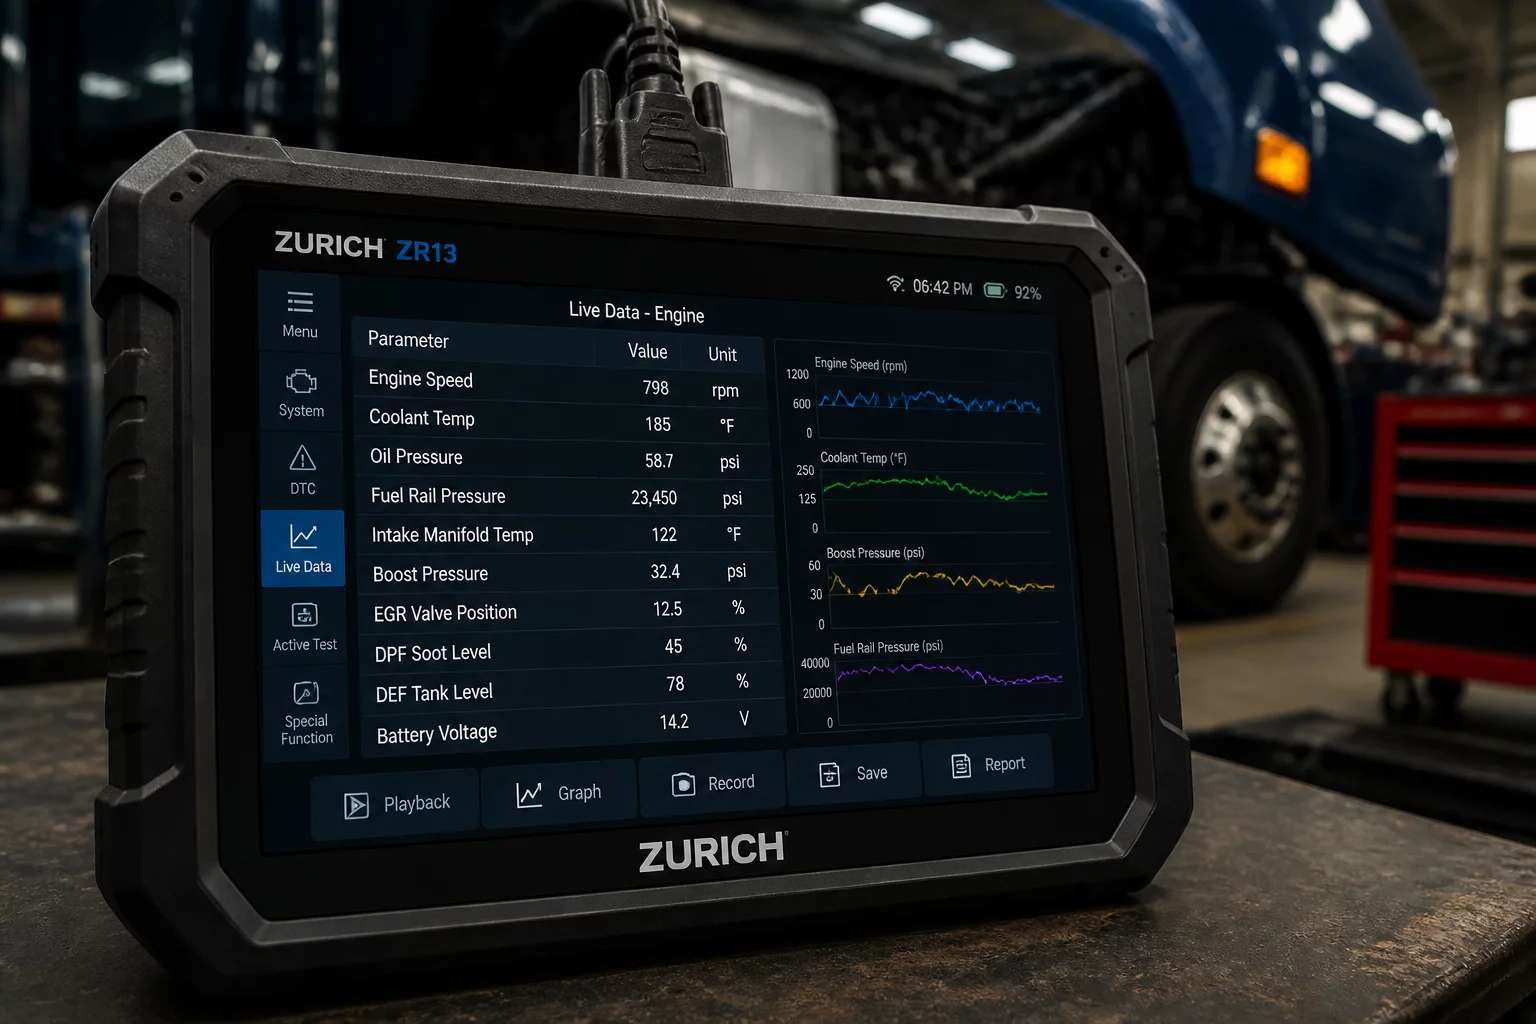
Analysis of updated commercial vehicle parameter parsing routines, live data validation matrices, and extended controller bus interactions.
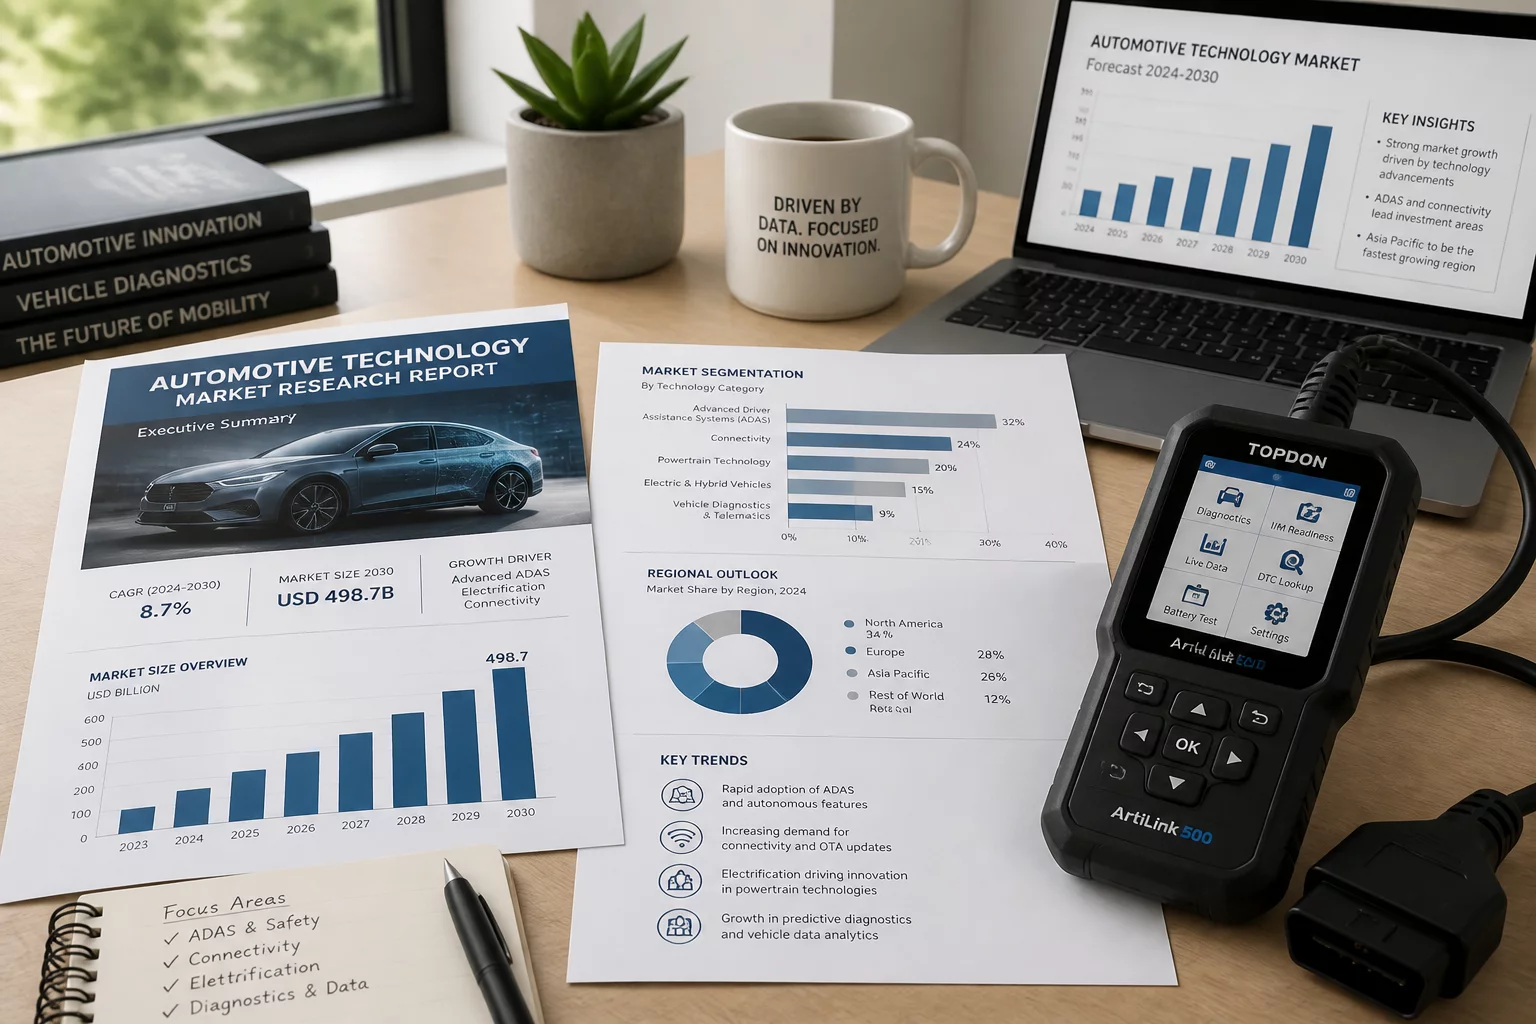
Technical review of scanning interface throughput, bandwidth benchmarks across automotive bus networks, and acquisition precision.
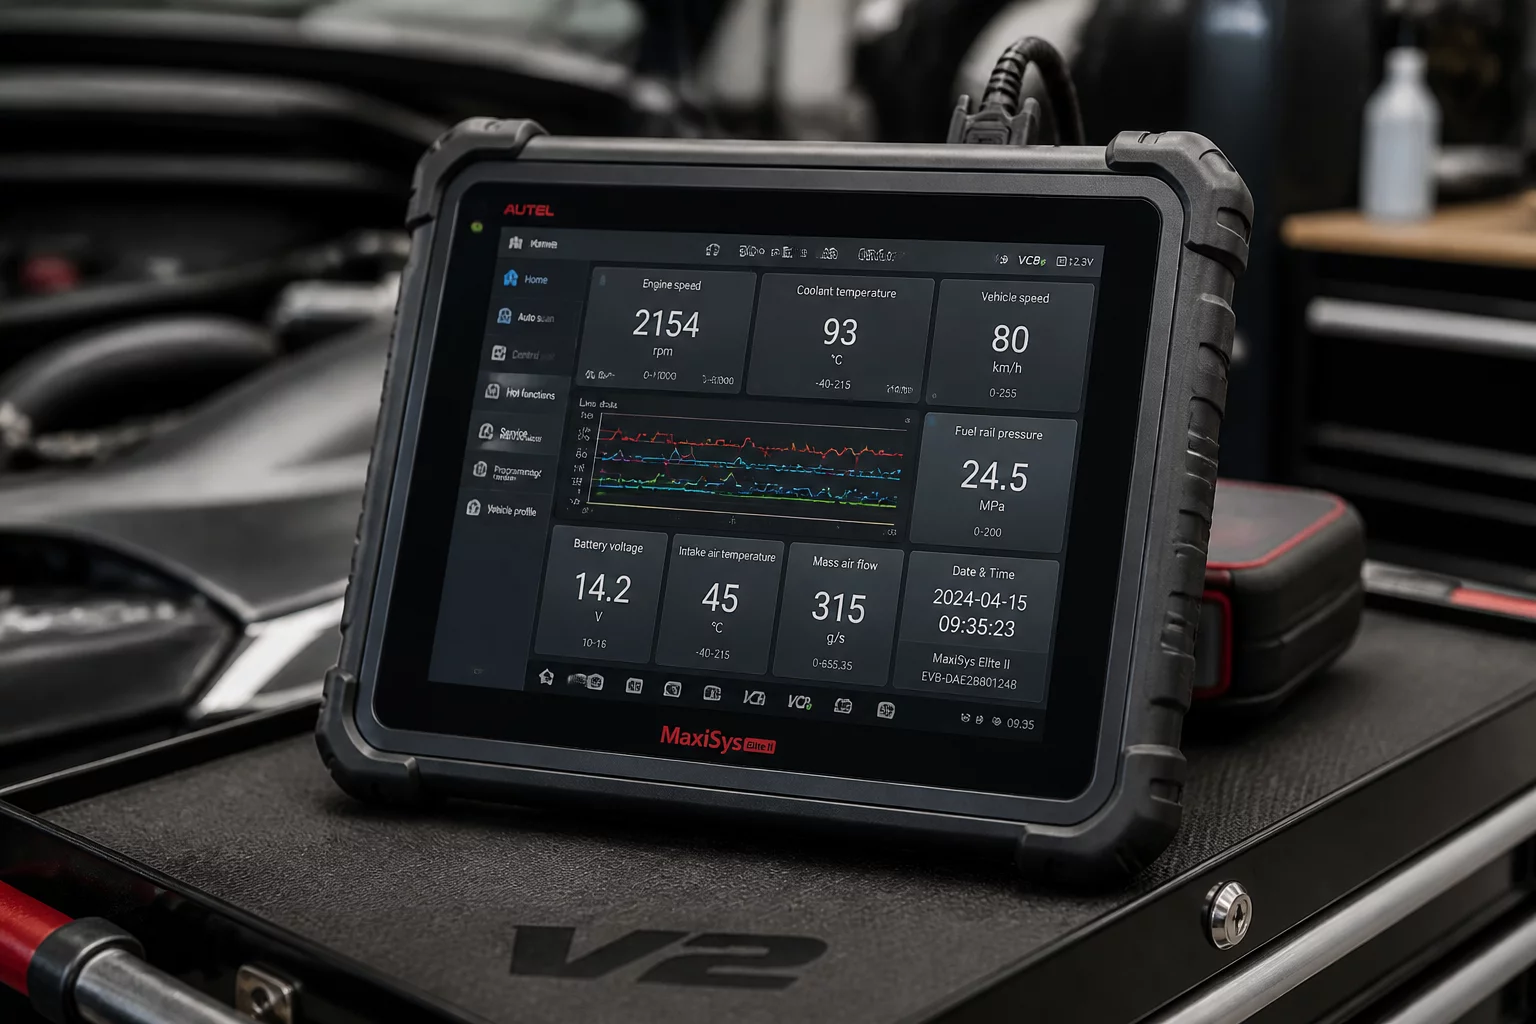
Methodological breakdown of enhanced telemetry capture, guided component verification tests, and integrated baseline comparison models.